
Analyzing your company’s financial health is like giving it a full-body scan. You might think you know what’s going on under the surface, but until you dig into the numbers, you’re just guessing.
In 2024, there are more tools and techniques than ever to help you get a clear picture of your business’s financial situation. From mastering financial statement analysis to leveraging profitability ratios, this guide will walk you through the most effective methods for assessing your company’s fiscal fitness.
So, whether you’re a seasoned entrepreneur or a new business owner, buckle up and get ready to learn how to give your company a financial check-up that would make even the most thorough doctor jealous.
Mastering Financial Statement Analysis for Business Success
- Gain deep insights into your company’s financial health
- Identify trends, strengths, and weaknesses to guide strategic decisions
- Learn to calculate and interpret key financial ratios for benchmarking
Understand the Three Key Financial Statements
To effectively analyze your company’s finances, you must have a solid grasp of the three primary financial statements: the balance sheet, income statement, and cash flow statement. Each statement provides unique insights into your business’s financial well-being.
The balance sheet offers a snapshot of your company’s assets, liabilities, and equity at a specific point in time. It helps you understand your business’s financial position, including what it owns (assets) and what it owes (liabilities). The income statement, also known as the profit and loss (P&L) statement, reveals your company’s revenues, expenses, and net income over a given period. This statement is crucial for assessing your business’s profitability. Lastly, the cash flow statement tracks the inflows and outflows of cash, helping you understand how well your company generates and manages its cash.
- Balance Sheet: Offers a snapshot of your company’s assets, liabilities, and equity at a specific point in time.
- Income Statement: Reveals your company’s revenues, expenses, and net income over a given period, crucial for assessing profitability.
- Cash Flow Statement: Tracks the inflows and outflows of cash, helping you understand how well your company generates and manages its cash.
By thoroughly understanding these statements, you can paint a comprehensive picture of your company’s financial health and make informed decisions based on concrete data.
Recommended Reading
“Financial Statements: A Step-by-Step Guide to Understanding and Creating Financial Reports” by Thomas Ittelson
This book is an excellent resource for those looking to deepen their understanding of financial statements. Ittelson breaks down complex concepts into easy-to-digest language, making it accessible for readers at all levels of financial expertise. The book covers the fundamentals of the three key financial statements and provides practical examples and exercises to reinforce learning.
Analyze Trends Over Time in Revenue, Expenses, Assets, and Liabilities
Analyzing trends in your financial statements is essential for identifying areas of strength and weakness within your company. By comparing year-over-year or quarter-over-quarter data, you can spot patterns and make informed decisions based on historical performance.
When examining revenue trends, look for consistent growth or any sudden spikes or dips. If you notice a decline in revenue, investigate the underlying causes, such as increased competition, changes in market demand, or pricing issues. Similarly, track expenses over time to identify areas where costs are rising disproportionately to revenue growth. This can help you pinpoint opportunities for cost reduction and efficiency improvements.
- Revenue Trends: Look for consistent growth or any sudden spikes or dips.
- Expense Trends: Track expenses over time to identify areas where costs are rising disproportionately to revenue growth.
- Assets and Liabilities Trends: Look for changes in your company’s debt-to-equity ratio and monitor accounts receivable and inventory levels to ensure they are not growing faster than sales.
Monitoring trends in assets and liabilities is also crucial. Look for changes in your company’s debt-to-equity ratio, which can indicate whether your business is becoming over-leveraged. Keep an eye on accounts receivable and inventory levels to ensure they are not growing faster than sales, which could signal potential cash flow issues.
Calculate and Interpret Key Financial Ratios
Financial ratios are powerful tools for evaluating your company’s performance and benchmarking against industry peers. By calculating and interpreting key ratios, you can gain deeper insights into your business’s liquidity, solvency, profitability, and efficiency.
Liquidity ratios, such as the current ratio and quick ratio, measure your company’s ability to meet short-term obligations. Solvency ratios, like the debt-to-equity ratio, assess your business’s long-term financial stability and its ability to repay long-term debts. Profitability ratios, including gross profit margin, operating profit margin, and return on equity (ROE), help you evaluate your company’s ability to generate profits relative to its revenue, assets, or equity. Efficiency ratios, such as inventory turnover and accounts receivable turnover, measure how effectively your business manages its assets and resources.
- Liquidity Ratios: Current ratio, quick ratio
- Solvency Ratios: Debt-to-equity ratio
- Profitability Ratios: Gross profit margin, operating profit margin, return on equity (ROE)
- Efficiency Ratios: Inventory turnover, accounts receivable turnover
When interpreting financial ratios, it’s essential to compare them against industry benchmarks and your company’s historical performance. This context helps you understand whether your ratios are within a healthy range and identify areas for improvement.
Conduct Horizontal and Vertical Analysis
Horizontal and vertical analysis are two techniques that can provide valuable insights into your company’s financial performance over time and in relation to other items on your financial statements.
Horizontal analysis, also known as trend analysis, involves comparing financial data across multiple periods. By calculating the percentage change in each line item from one period to the next, you can identify trends and growth rates. This analysis helps you spot areas of your business that are growing or shrinking and can inform strategic decisions around resource allocation and investment.
Vertical analysis, or common-size analysis, expresses each line item on a financial statement as a percentage of a base figure. For example, on an income statement, each item is stated as a percentage of total revenue. This allows you to see the relative importance of each item and how it contributes to the overall performance of your business. Vertical analysis is particularly useful for comparing your company’s financial structure to industry peers, regardless of size differences.
Case Study: Apple Inc.’s Horizontal and Vertical Analysis
Apple Inc.’s financial statements provide an excellent example of how horizontal and vertical analysis can reveal crucial insights into a company’s financial health. By examining Apple’s 2020 financial data, we can better understand the trends and structure of its financial performance.
Horizontal Analysis
Horizontal analysis, also known as trend analysis, involves comparing financial data across multiple periods. For Apple, we can analyze the percentage change in key financial metrics from 2019 to 2020:
- Total Net Sales: In 2020, Apple reported total net sales of $274.5 billion, up from $260.2 billion in 2019. This represents a 5.5% increase, indicating steady revenue growth despite the challenges posed by the global pandemic.
- Net Income: Apple’s net income for 2020 was $57.4 billion, up from $55.3 billion in 2019, a 3.8% increase. This growth suggests that Apple managed to improve its profitability alongside its revenue.
By tracking these changes year-over-year, businesses can identify growth trends and potential areas of concern.
Vertical Analysis
Vertical analysis, or common-size analysis, involves expressing each line item on a financial statement as a percentage of a base figure to understand the relative size and importance of each component. For Apple’s income statement in 2020:
- Cost of Sales: Represented 61.5% of total net sales. This indicates that a significant portion of Apple’s revenue is consumed by the cost of producing its goods, which is a critical factor for managing gross margins.
- Operating Expenses: Accounted for 12.4% of total net sales. Keeping operating expenses in check is essential for maintaining profitability.
- Net Income: Was 20.9% of total net sales, showcasing Apple’s strong profitability relative to its revenue.
These vertical percentages help illustrate how much of Apple’s revenue is consumed by various expenses and how much is left as profit, providing insights into the company’s cost structure and efficiency.
Comprehensive Financial Health Picture
By combining horizontal and vertical analyses, Apple can monitor its financial performance over time and make strategic decisions to enhance its growth and profitability. For instance, the slight decrease in the gross margin percentage (from 37.8% in 2019 to 38.2% in 2020) despite an increase in net sales suggests that Apple managed its production costs effectively during the year.
Professional Guidance
While these analyses provide valuable insights, working with financial professionals such as certified public accountants (CPAs) or financial advisors can further enhance the accuracy and depth of financial analysis. These experts can offer tailored advice, help interpret complex financial data, and recommend strategic actions to improve financial health and achieve business goals.
For more detailed information, you can refer to Apple’s 2020 Annual Report here and additional analysis on financial trends and key metrics from Investopedia.
Consider Seeking Professional Guidance
While mastering financial statement analysis is crucial for any business leader, there may be times when seeking professional guidance is necessary. Consider working with a certified public accountant (CPA) or financial advisor to help you navigate complex financial issues or gain an outside perspective on your company’s performance.
These professionals can offer valuable insights and recommendations based on their experience and expertise. They can also help you develop custom financial ratios and benchmarks tailored to your specific industry and business model.
When selecting a financial professional, look for someone with experience working with businesses similar in size and scope to yours. Ask for references and check their credentials to ensure they have the necessary qualifications and expertise to meet your needs.
Effective Cash Flow Management Strategies
- Optimize your company’s cash inflows and outflows
- Implement strategies to maintain a healthy cash balance
- Forecast future cash needs and plan accordingly
Cash flow management is crucial for any business to ensure it has sufficient funds to cover expenses, invest in growth, and weather unforeseen challenges. By analyzing your company’s cash flow, optimizing accounts receivable and payable, and forecasting future cash needs, you can maintain a strong financial position and make informed decisions.
Perform a cash flow analysis
A cash flow analysis involves tracking the inflows and outflows of cash over a specific period, typically monthly or quarterly. This process helps you identify the sources of cash, such as sales revenue or investments, and the uses of cash, like operating expenses, debt payments, or capital expenditures.
To conduct a cash flow analysis:
- Gather financial statements, including the balance sheet and income statement, for the period you want to analyze.
- Categorize cash inflows and outflows into operating, investing, and financing activities.
- Calculate the net cash flow for each category and the overall net cash flow for the period.
Interpreting the results
Once you’ve completed the cash flow analysis, examine the results to identify trends, potential issues, and opportunities for improvement. For example:
- If operating cash flow is consistently negative, it may indicate that the company is struggling to generate enough revenue to cover expenses.
- Positive investing cash flow could suggest that the company is selling assets or receiving returns on investments.
- Negative financing cash flow might indicate that the company is repaying debt or distributing dividends to shareholders.
Optimize accounts receivable and payable
Managing accounts receivable and payable is essential for maintaining a healthy cash flow. By speeding up collections from customers and negotiating better payment terms with suppliers, you can improve your company’s cash position.
To optimize accounts receivable:
- Set clear payment terms and communicate them to customers upfront.
- Invoice promptly and accurately to avoid delays in payment.
- Follow up on overdue invoices consistently and professionally.
- Consider offering early payment discounts to incentivize customers to pay quickly.
To optimize accounts payable:
- Negotiate longer payment terms with suppliers to preserve cash for a longer period.
- Take advantage of early payment discounts offered by suppliers, if the discount rate exceeds your cost of capital.
- Prioritize payments based on their impact on the business and supplier relationships.
- Automate payment processes to ensure timely and accurate payments.
Implement cash flow forecasting
Cash flow forecasting involves projecting future cash inflows and outflows based on historical data, industry trends, and anticipated changes in the business. By creating a cash flow forecast, you can plan for potential shortfalls or surpluses and make informed decisions about investments, financing, and risk management.
To create a cash flow forecast:
- Start with your current cash balance and add expected cash inflows, such as sales revenue, investments, or financing.
- Subtract anticipated cash outflows, including operating expenses, debt payments, and capital expenditures.
- Repeat this process for each period in your forecast, typically 12 months or more.
- Regularly update the forecast based on actual results and changes in assumptions.
Scenario planning
To prepare for uncertainties, consider creating multiple cash flow forecasts based on different scenarios, such as:
- Best-case scenario: Higher-than-expected sales growth and lower expenses
- Base-case scenario: Most likely outcome based on current trends and assumptions
- Worst-case scenario: Lower-than-expected sales and higher expenses
By planning for various scenarios, you can develop contingency plans and make informed decisions to mitigate risks and capitalize on opportunities.
Effective cash flow management is essential for evaluating a company’s financial health and ensuring its long-term success. By regularly analyzing cash flow, optimizing accounts receivable and payable, and forecasting future cash needs, you can make data-driven decisions to support your company’s growth and stability.
Leveraging Profitability Ratios to Boost the Bottom Line
- Understand how profitability ratios help measure and improve financial performance
- Learn to calculate and interpret key profitability ratios
- Discover how to use profitability ratios to make data-driven decisions
Profitability ratios are essential tools for assessing a company’s financial health and identifying areas for improvement. By calculating and analyzing these ratios, you can gain valuable insights into your company’s ability to generate profits and make informed decisions to boost your bottom line.
Calculate gross profit margin, operating profit margin, net profit margin
Profitability ratios measure a company’s ability to generate profits at different levels of operation. The three main profitability ratios are gross profit margin, operating profit margin, and net profit margin.
Gross profit margin
Gross profit margin measures the percentage of revenue that remains after subtracting the cost of goods sold (COGS). To calculate gross profit margin:
- Determine your company’s total revenue for the period
- Subtract the cost of goods sold from the total revenue
- Divide the result by total revenue and multiply by 100 to get the percentage
A higher gross profit margin indicates that your company is efficiently managing its production costs and pricing strategy. According to a study by Deloitte, a higher gross margin can lead to increased profitability and competitiveness.
Operating profit margin
Operating profit margin measures the percentage of revenue that remains after subtracting COGS and operating expenses, such as salaries, rent, and utilities. To calculate operating profit margin:
- Start with your company’s operating profit (revenue minus COGS and operating expenses)
- Divide operating profit by total revenue and multiply by 100 to get the percentage
Operating profit margin provides insight into how well your company manages its operating costs relative to revenue. As noted by Investopedia, a higher operating profit margin indicates better cost management and higher profitability.
Net profit margin
Net profit margin measures the percentage of revenue that remains as net income after subtracting all expenses, including taxes and interest. To calculate net profit margin:
- Determine your company’s net income (total revenue minus all expenses)
- Divide net income by total revenue and multiply by 100 to get the percentage
Net profit margin is a key indicator of overall profitability and shows how much of each dollar in revenue translates into profits. According to Forbes, a higher net profit margin indicates a company’s ability to maintain profitability in the long term.
By calculating and comparing these profitability ratios over time and against industry benchmarks, you can identify areas for cost reduction or price increases to improve your company’s profitability.
Analyze return on assets (ROA) and return on equity (ROE)
ROA and ROE are two important profitability ratios that measure how efficiently a company uses its assets and equity to generate profits.
Return on assets (ROA)
ROA measures the percentage of profit generated relative to a company’s total assets. To calculate ROA:
- Determine your company’s net income for the period
- Divide net income by average total assets (beginning assets + ending assets / 2) and multiply by 100 to get the percentage
A higher ROA indicates that your company is using its assets more efficiently to generate profits. According to Morningstar, a higher ROA is generally associated with better asset utilization and higher profitability.
Return on equity (ROE)
ROE measures the percentage of profit generated relative to the equity invested by shareholders. To calculate ROE:
- Start with your company’s net income for the period
- Divide net income by average shareholder equity (beginning equity + ending equity / 2) and multiply by 100 to get the percentage
A higher ROE suggests that your company is effectively using shareholders’ investments to generate profits. As noted by The Balance, a higher ROE indicates a company’s ability to generate profits from shareholder investments.
By comparing your company’s ROA and ROE to industry benchmarks, you can assess your financial performance relative to competitors and identify areas for improvement.
Conduct a break-even analysis
A break-even analysis determines the sales volume needed to cover all costs and helps set profitability targets.
Steps to Calculate Break-Even Point:
- Identify Fixed Costs: Determine the total fixed costs for the period.
- Determine Variable Costs per Unit: Calculate the cost associated with producing one unit of product.
- Calculate Contribution Margin per Unit: Subtract the variable cost per unit from the selling price per unit.
- Calculate Break-Even Point in Units: Divide the fixed costs by the contribution margin per unit.
- Calculate Break-Even Point in Dollars: Multiply the break-even point in units by the selling price per unit.
Break-Even Analysis
To illustrate the break-even point and various scenarios above and below it, let’s create a table that outlines the calculations:
| Scenario | Fixed Costs | Variable Costs per Unit | Selling Price per Unit | Contribution Margin per Unit | Break-Even Point (Units) | Break-Even Point ($) |
|---|---|---|---|---|---|---|
| Base Case | $50,000 | $20 | $50 | $30 | 1,667 | $83,333 |
| Best-Case Scenario | $50,000 | $15 | $55 | $40 | 1,250 | $68,750 |
| Worst-Case Scenario | $50,000 | $25 | $45 | $20 | 2,500 | $112,500 |
Definitions:
- Fixed Costs: Costs that do not change with the level of production or sales (e.g., rent, salaries).
- Variable Costs per Unit: Costs that vary directly with the level of production (e.g., materials, direct labor).
- Selling Price per Unit: The amount at which a product is sold.
- Contribution Margin per Unit: Selling price per unit minus variable costs per unit.
- Break-Even Point (Units): Fixed costs divided by contribution margin per unit.
- Break-Even Point ($): Break-even point in units multiplied by the selling price per unit.
Example Calculations:
- Base Case:
- Fixed Costs: $50,000
- Variable Costs per Unit: $20
- Selling Price per Unit: $50
- Contribution Margin per Unit: $50 – $20 = $30
- Break-Even Point (Units): $50,000 / $30 = 1,667 units
- Break-Even Point ($): 1,667 units * $50 = $83,333
- Best-Case Scenario:
- Fixed Costs: $50,000
- Variable Costs per Unit: $15
- Selling Price per Unit: $55
- Contribution Margin per Unit: $55 – $15 = $40
- Break-Even Point (Units): $50,000 / $40 = 1,250 units
- Break-Even Point ($): 1,250 units * $55 = $68,750
- Worst-Case Scenario:
- Fixed Costs: $50,000
- Variable Costs per Unit: $25
- Selling Price per Unit: $45
- Contribution Margin per Unit: $45 – $25 = $20
- Break-Even Point (Units): $50,000 / $20 = 2,500 units
- Break-Even Point ($): 2,500 units * $45 = $112,500
These calculations demonstrate how different scenarios can impact the break-even point, helping businesses plan and make informed decisions about pricing, cost management, and sales strategies.
By understanding your break-even point, you can set sales targets that ensure profitability and make informed decisions about pricing, cost control, and production levels.
Leveraging profitability ratios is a crucial step in assessing and improving your company’s financial performance. By calculating and analyzing these ratios, you can identify areas for cost reduction, set profitability targets, and make data-driven decisions to boost your bottom line.
Essential Budgeting and Forecasting Techniques
- Create a master budget to align financial plans with business strategy
- Use scenario and sensitivity analysis to stress-test assumptions
- Monitor actual results against budget and investigate variances
Create a master budget
A master budget is a comprehensive financial plan that includes three key components: the operating budget, capital expenditure budget, and cash budget. The operating budget focuses on the company’s day-to-day activities, such as revenue and expenses, while the capital expenditure budget outlines investments in long-term assets like equipment or facilities. The cash budget ensures that the company has sufficient liquidity to meet its obligations.
To create an effective master budget, it’s crucial to align the budgets with the overall business strategy and goals. This means considering factors such as market conditions, competitive landscape, and internal capabilities when setting financial targets. By doing so, the master budget becomes a powerful tool for guiding decision-making and resource allocation across the organization.
Involve key stakeholders in the budgeting process
Engaging key stakeholders from various departments, such as sales, marketing, and operations, in the budgeting process can lead to more accurate and realistic financial plans. These stakeholders can provide valuable insights into their respective areas, helping to identify potential challenges and opportunities that may impact the budget.
For example, involving the sales team can help set realistic revenue targets based on pipeline and market conditions. The marketing team can provide insights on campaign costs and ROI, while the operations team can offer feedback on production capacity and efficiency.
Use scenario analysis and sensitivity analysis
Scenario analysis involves modeling best-case, worst-case, and most likely scenarios to assess the potential impact of different variables on the company’s financial performance. This technique helps managers prepare for a range of possible outcomes and develop contingency plans accordingly.
Sensitivity analysis, on the other hand, tests the sensitivity of key assumptions and variables within the budget. By adjusting these factors and observing the resulting changes in financial projections, managers can identify which variables have the greatest impact on the company’s bottom line. This information can be used to prioritize risk mitigation efforts and inform strategic decision-making.
Incorporate Monte Carlo simulation for advanced scenario analysis
Monte Carlo simulation is a powerful tool for conducting advanced scenario analysis. This technique involves running numerous simulations with randomly generated input values to assess the probability of different outcomes. By incorporating Monte Carlo simulation into the budgeting and forecasting process, companies can gain a more nuanced understanding of the potential risks and opportunities they face.
For instance, a retail company used Monte Carlo simulation to forecast demand for specific products based on factors such as seasonality, weather patterns, and promotional activities. By incorporating these insights into the budgeting process, the company was able to better align its inventory and staffing levels with expected demand, reducing the risk of stockouts or overstocking.
Real-World Case Study: Walmart’s Use of Monte Carlo Simulation
Background: Walmart, one of the world’s largest retail companies, faces complex challenges in managing inventory levels across its vast network of stores. Accurate forecasting of product demand is crucial to avoid stockouts or overstocking, which can lead to lost sales or excess inventory costs.
Objective: To enhance its demand forecasting and inventory management, Walmart decided to incorporate Monte Carlo simulation into its budgeting and forecasting processes.
Implementation:
- Data Collection: Walmart collected extensive historical data on product sales, incorporating various influencing factors such as seasonality, weather patterns, promotional activities, and economic indicators.
- Monte Carlo Simulation: Using Monte Carlo simulation, Walmart ran numerous simulations with randomly generated input values based on the collected data. This approach allowed them to model a wide range of potential scenarios and their impact on product demand.
- Scenario Analysis: The simulations provided insights into best-case, worst-case, and most likely demand scenarios for each product category. This detailed analysis helped Walmart understand the probability of different demand outcomes.
- Decision Making: Armed with the insights from the Monte Carlo simulation, Walmart could make more informed decisions about inventory levels. They adjusted their inventory policies to align with the most likely demand scenarios while also preparing for potential fluctuations.
Results:
- Improved Forecast Accuracy: By using Monte Carlo simulations, Walmart significantly improved the accuracy of its demand forecasts. This led to better alignment of inventory levels with actual customer demand.
- Cost Savings: The enhanced forecasting accuracy resulted in cost savings by reducing instances of overstocking and stockouts. Walmart optimized its inventory levels, leading to more efficient use of storage space and capital.
- Customer Satisfaction: Improved inventory management ensured that products were available when customers needed them, enhancing overall customer satisfaction and loyalty.
Conclusion: Walmart’s adoption of Monte Carlo simulation for demand forecasting and inventory management illustrates the power of advanced analytics in retail operations. By leveraging this technique, Walmart not only optimized its inventory levels but also achieved significant cost savings and improved customer satisfaction.
References:
- “The Application of Monte Carlo Simulation in Supply Chain Management” – ResearchGate
- “Walmart’s Approach to Inventory Management and Forecasting” – Industry Case Studies
This case study exemplifies how a major retailer successfully implemented Monte Carlo simulation to enhance its operational efficiency and financial performance.
Monitor actual results vs. budget
Regularly comparing actual financial results against budgeted amounts is essential for identifying variances and taking corrective action when necessary. Calculating variances involves determining the difference between actual and budgeted figures for key metrics such as revenue, expenses, and cash flow.
When significant variances are identified, it’s important to investigate the underlying causes. This may involve analyzing factors such as changes in market conditions, unexpected costs, or shifts in customer behavior. By understanding the reasons behind variances, managers can make informed decisions about how to adjust their strategies and tactics to get back on track.
Establish a cadence for budget reviews and adjustments
Setting a regular cadence for reviewing actual results against the budget can help ensure that variances are identified and addressed in a timely manner. Many companies conduct monthly or quarterly budget reviews, depending on the nature of their business and the volatility of their industry.
During these reviews, it’s important to not only identify variances but also to discuss potential adjustments to the budget based on new information or changing circumstances. This agile approach to budgeting and forecasting can help companies stay responsive to evolving market conditions and customer needs.
Leverage data analytics to enhance forecasting accuracy
Data analytics has revolutionized the way companies approach budgeting and forecasting. By leveraging tools like machine learning algorithms and predictive modeling, companies can analyze vast amounts of historical data to identify patterns and trends that can inform more accurate financial projections.
For example, a retail company could use data analytics to forecast demand for specific products based on factors such as seasonality, weather patterns, and promotional activities. By incorporating these insights into the budgeting process, the company can better align its inventory and staffing levels with expected demand, reducing the risk of stockouts or overstocking.
Consider implementing rolling forecasts
Rolling forecasts are an alternative to traditional annual budgeting that involves continuously updating financial projections based on the latest data and insights. This approach allows companies to be more responsive to changing market conditions and customer needs, as they can adjust their plans on a more frequent basis.
By implementing rolling forecasts, companies can reduce the time and effort required for the annual budgeting process while also improving the accuracy and relevance of their financial projections. This can lead to better decision-making and resource allocation across the organization.
Foster a culture of financial accountability
Creating a culture of financial accountability is essential for ensuring that budgets and forecasts are taken seriously throughout the organization. This means communicating the importance of financial discipline to all employees and providing them with the tools and training they need to make informed decisions about spending and resource allocation.
One way to foster financial accountability is to tie individual and team performance metrics to budget adherence. By making budget performance a key component of employee evaluations and incentives, companies can encourage a greater sense of ownership and responsibility for financial results.
Encourage cross-functional collaboration in budgeting and forecasting
Encouraging cross-functional collaboration in the budgeting and forecasting process can also help foster a culture of financial accountability. When different departments work together to develop and monitor financial plans, they gain a better understanding of how their actions impact the company’s overall performance.
This collaborative approach can also lead to more creative problem-solving and innovation, as team members from different areas of the business bring their unique perspectives and insights to the table. By breaking down silos and encouraging open communication, companies can create a more agile and responsive budgeting and forecasting process.
What Is Financial Analysis and Why Is It Critical?
- Understand the purpose and benefits of financial analysis
- Discover who performs financial analysis and why
- Learn how financial analysis drives business success
Definition and purpose of financial analysis
Financial analysis is the process of evaluating businesses, projects, budgets, and other finance-related transactions to determine their viability, stability, and profitability. It involves examining financial statements, such as balance sheets, income statements, and cash flow statements, to assess a company’s financial health and performance.
The primary purpose of financial analysis is to provide insights into a company’s financial position, allowing stakeholders to make informed decisions. By analyzing financial data, businesses can identify trends, patterns, and potential issues that may impact their operations and bottom line.
Benefits of regular financial analysis
Conducting regular financial analysis offers several key benefits for businesses:
Identifies strengths and weaknesses in financial performance
Financial analysis helps pinpoint areas where a company excels and where it may be struggling. By examining financial ratios, such as profitability, liquidity, and efficiency ratios, businesses can identify their strengths and weaknesses. This information can then be used to develop strategies to capitalize on strengths and address weaknesses.
Enables data-driven decision making
With the insights gained from financial analysis, business owners and managers can make more informed, data-driven decisions. Rather than relying on gut instincts or assumptions, they can use concrete financial data to guide their choices. This approach leads to more effective resource allocation, improved risk management, and better overall business performance.
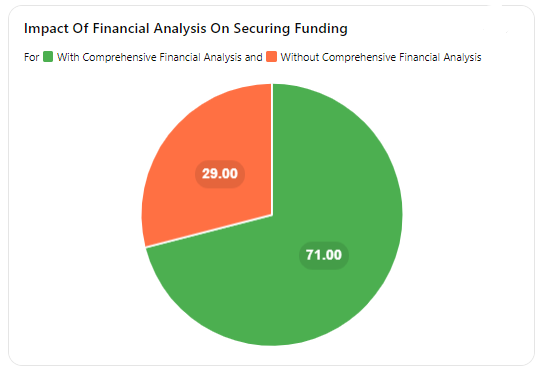
Helps secure financing from lenders and investors
When seeking funding from lenders or investors, a thorough financial analysis is essential. Potential financiers will want to see a clear picture of a company’s financial health and growth potential before committing their resources. By presenting a well-prepared financial analysis, businesses can demonstrate their viability and increase their chances of securing the necessary funding to support their growth and development.
According to a study by the Small Business Administration, businesses that have a comprehensive financial plan are more likely to secure funding, with 71% of funded businesses having a written plan.
Who performs financial analysis
Financial analysis is performed by various stakeholders, both within and outside a company:
Business owners and managers
Business owners and managers are responsible for the day-to-day operations and long-term success of their companies. As such, they need to regularly analyze financial data to make informed decisions, monitor performance, and adjust strategies as needed. By staying on top of their company’s financial health, they can proactively address issues and seize opportunities for growth.
Investors and lenders
Investors and lenders rely on financial analysis to assess the potential risks and rewards of investing in or lending to a particular company. They examine financial statements, ratios, and other relevant data to determine whether a company is a sound investment or borrower. Thorough financial analysis helps them make informed decisions and protect their interests.
Financial analysts and accountants
Financial analysts and accountants are trained professionals who specialize in analyzing financial data. They may work within a company’s finance department or as external consultants. These experts use their skills and knowledge to provide detailed insights into a company’s financial performance, identify trends and patterns, and offer recommendations for improvement.
Key Financial Metrics Every Business Owner Should Know
- Understand your company’s financial health with these essential metrics
- Track profitability, liquidity, and solvency to make informed decisions
- Use these metrics to identify areas for improvement and growth
As a business owner, it’s crucial to have a clear understanding of your company’s financial performance. By tracking key financial metrics, you can make informed decisions, identify areas for improvement, and ensure the long-term success of your business. Let’s explore the most important metrics you should monitor.
Profitability metrics
Profitability metrics help you understand how effectively your company generates profits from its operations. According to Dave Ramsey, a renowned financial expert, “Profit is not an event. Profit is a habit.” By regularly tracking your profitability, you can develop a habit of making smart financial decisions.
Gross profit margin, operating profit margin, net profit margin
These metrics measure your company’s ability to generate profits at different levels of operation. Gross profit margin shows the percentage of revenue left after deducting the cost of goods sold. Operating profit margin takes into account operating expenses, while net profit margin considers all expenses, including taxes and interest.
- Retail: Gross profit margin: 25-40%, Operating profit margin: 5-10%, Net profit margin: 3-5%
- Manufacturing: Gross profit margin: 20-30%, Operating profit margin: 10-15%, Net profit margin: 5-10%
Return on assets (ROA), return on equity (ROE)
ROA measures how efficiently your company generates profits from its assets, while ROE measures the return generated for shareholders. “ROE is the single best measure of performance in business, both for managers and for investors,” says Warren Buffett, one of the most successful investors in history.
- ROA: 5-20%
- ROE: 10-30%
Liquidity metrics
Liquidity metrics help you assess your company’s ability to meet its short-term financial obligations. As James Dahle, a physician and financial blogger, puts it, “Liquidity is like oxygen. You don’t notice it until it’s gone.”
Current ratio, quick ratio
The current ratio compares your current assets to current liabilities, while the quick ratio excludes inventory from current assets. These ratios indicate your company’s ability to pay off short-term debts.
- Current ratio: 1.5-3.0
- Quick ratio: 1.0-2.0
Working capital
Working capital is the difference between your current assets and current liabilities. It represents the funds available for day-to-day operations. As Robert Kiyosaki, author of “Rich Dad Poor Dad,” states, “The most important word in the world of money is cash flow. The second most important word is leverage.”
Ensure your working capital is positive and growing over time.
Solvency metrics
Solvency metrics help you understand your company’s ability to meet its long-term financial obligations and stay in business.
Debt-to-equity ratio
This ratio compares your total debt to shareholder equity. It indicates the extent to which your company relies on debt financing. “The best way to maximize your business profits is to minimize your debt,” advises Suze Orman, a personal finance expert.
- Debt-to-equity ratio: 0.5-2.0
Interest coverage ratio
The interest coverage ratio measures your company’s ability to pay interest on its outstanding debt. It’s calculated by dividing your earnings before interest and taxes (EBIT) by your interest expenses. “Interest never sleeps nor sickens nor dies… Once in debt, interest is your companion every minute of the day and night,” warns Cary Grant, a legendary actor.
- Interest coverage ratio: 3.0 or higher
By regularly monitoring these key financial metrics, you can gain valuable insights into your company’s financial health and make data-driven decisions to drive growth and success.
Master Your Company’s Financial Health in 2024
Financial analysis is the key to understanding your company’s financial health and making informed decisions for growth. By mastering the techniques covered in this article, you’ll be well-equipped to navigate the financial landscape of your business.
Focus on analyzing your financial statements, managing cash flow effectively, and leveraging profitability ratios to boost your bottom line. Don’t forget the power of budgeting and forecasting to keep your company on track.
As a business owner, it’s crucial to stay on top of key financial metrics like profitability, liquidity, and solvency. These numbers provide valuable insights into your company’s performance and help you identify areas for improvement.
Ready to take control of your company’s financial future?
Start by implementing the strategies and techniques outlined in this article. Set aside time each month to review your financial statements, calculate key ratios, and compare your performance to industry benchmarks.
What’s one financial metric you’re most excited to track and improve this year?
Discover Your Next Lever For Growth.
Every week, get an insider analysis of the largest eCom/Retail brands’ financials + a 3-Step Turnaround Plan for each biz. Your next growth opportunity is just an email away.
Join 4,210+ readers from Quip, Dr. Squatch, Jamby’s, Volcom and more.